
Griping About Grype and How a Three-Minute Scan Became a Four-Second Scan
14 min read
While optimizing MegaLinter on my Jenkins infrastructure, one scanner stood out. Grype was consistently taking roughly three minutes to analyze a small Bash project whose generated artifact was about 12.3 KB.
At that point, the broader MegaLinter work had already taught me to be cautious about attributing an elapsed time directly to the thing named in a timing report. Moving the workload from GitHub Actions to Jenkins had initially made it slower, and the later improvement came from understanding image acquisition, persistence, locality, and cache lifecycles rather than from the platform change itself.
Grype looked like the next version of the same kind of problem.
Three minutes to scan almost nothing
One representative Grype result looked like this:
| Run | Grype runtime |
|---|---|
| Representative run | 186.64 seconds |
| Additional run 1 | 192.72 seconds |
| Additional run 2 | 189.66 seconds |
| Additional run 3 | 186.88 seconds |
That immediately attracted my attention. This was not a large container image containing thousands of operating-system and application packages, a monorepo, or a software distribution with an enormous dependency graph. The thing being scanned was measured in tens of kilobytes.
The rest of MegaLinter made the difference even more conspicuous. One representative run looked approximately like this:
| Linter | Runtime |
|---|---|
| editorconfig-checker | 0.03s |
| npm-groovy-lint | 23.42s |
| checkov | 28.98s |
| git_diff | 0.03s |
| betterleaks | 2.97s |
| grype | 186.64s |
| secretlint | 3.09s |
| syft | 20.46s |
| trivy | 21.96s |
| trivy-sbom | 0.31s |
| trufflehog | 5.72s |
| kingfisher | 22.07s |
| cspell | 7.07s |
Grype’s runtime was on a different scale from every other tool in that list.
I could have disabled it, decided that vulnerability scanning was too expensive for this repository, or concluded that Grype was inherently slow. Before doing any of those things, I wanted to know where the time was actually going. That distinction became important because my first explanation was reasonable and wrong.
A reasonable hypothesis that did not survive the experiment
Grype depends upon a vulnerability database that is much larger than the repository being scanned, so my first suspicion was network traffic. If every disposable MegaLinter container was downloading a large database from the Internet before examining a 12 KB artifact, then the apparent absurdity of a three-minute scan would make more sense.
I already operate Nexus Repository Manager internally, so I created a raw proxy repository for Grype’s database endpoint. Rather than hardcoding that private URL into the Makefile, I added a portable variable:
LINT_GRYPE_DB_URL ?= https://grype.anchore.io/databasesand passed it into MegaLinter’s container as:
-e GRYPE_DB_UPDATE_URL="$(LINT_GRYPE_DB_URL)"Jenkins could then override LINT_GRYPE_DB_URL at the Organization Folder level while everyone else continued using Anchore’s public endpoint.
The Nexus proxy worked exactly as intended. I verified that it could retrieve Grype’s metadata, including:
v6/latest.jsonand confirmed that Nexus cached the vulnerability database archive itself. That archive was about 145.5 MB.
I expected a substantial improvement on the next run. If repeated Internet transfers were responsible for most of the three-minute delay, moving those transfers onto my local network should have removed a large part of the cost.
The next two runs looked like this:
| Run | Grype runtime |
|---|---|
| First run through Nexus | 192.72 seconds |
| Subsequent run | 189.66 seconds |
That result was valuable precisely because the optimization had worked. Nexus was serving the database, and Grype was using the proxy, so network acquisition had improved while runtime barely moved. I had optimized something real, but I had not optimized the thing consuming most of those three minutes.
Looking inside Grype’s database lifecycle
At that point, I spent more time with Grype’s documentation and issue tracker, and several details changed how I understood the problem.
Grype’s vulnerability database is a SQLite database. Current database version 6 is distributed as a compressed archive containing a prebuilt database and associated metadata. Grype is therefore not retrieving raw feeds from every vulnerability provider and rebuilding the entire vulnerability corpus from scratch whenever I invoke it. The client still has work to perform around that database: it may need to retrieve the archive, verify it, extract it, install it, migrate it where necessary, and load the resulting database into its local cache.
The database itself is substantial once installed. One discussion of Grype’s future database architecture describes the current database as containing millions of records across more than 20 providers and occupying roughly 1.6 GB uncompressed. That size matters because the repository being scanned and the database used to evaluate it are two completely different things. My input might have been twelve kilobytes; Grype’s knowledge about the vulnerability ecosystem was measured in gigabytes.
The most useful clue came from Grype issue #2794, “Add --parallelism flag”. The original issue concerned a scan using:
--add-cpes-if-nonewith thousands of components. The reporter had experimented with parallelism in hopes of accelerating the scan. A Grype maintainer explained that concurrency had not yet been added to the matching process, so the configured parallelism would not affect that part of the operation.
The discussion then produced a more useful experiment for my purposes. A maintainer generated an SBOM for Nextcloud containing 479 packages and ran:
grype sbom:nextcloud-sbom.json --add-cpes-if-noneThe comparison was stark:
| Database state | Runtime |
|---|---|
| Healthy vulnerability database | 3.358 seconds |
| SQLite indexes deliberately removed | 12 minutes, 25.613 seconds |
The benchmark is documented here:
That comparison changed the direction of my investigation. It demonstrated that --add-cpes-if-none did not inherently turn Grype into a multi-minute scanner. Hundreds of packages could be matched in a few seconds when the underlying database was healthy and ready for use. It also demonstrated that database state could move total runtime from seconds to minutes.
Another issue contained debug timings for more than 1,000 packages. Package discovery consumed several seconds, cold database download and setup took roughly half a minute, and vulnerability matching itself took less than a second. The pattern pointed away from expensive vulnerability matching and toward expensive database lifecycle work.
The state I kept deleting
My MegaLinter invocation looked approximately like this:
docker run --rm \
    -v "$(pwd):/tmp/lint:rw" \
    ...
    oxsecurity/megalinter
The important part was the flag:
--rmI use disposable containers intentionally. The repository workspace is mounted into MegaLinter, the tools run, reports are written back to the workspace, and Docker removes the container afterward. That gives me a clean execution environment on the next run.
Grype’s database cache lived inside that same disposable filesystem. Every MegaLinter invocation therefore gave Grype a new environment with no persistent local database state. Nexus had shortened the path used to retrieve the compressed database archive, although Grype still had to install and prepare the database inside the fresh container. Docker then deleted that prepared state, and the next job repeated the work.
I had solved the wrong cache problem. Nexus preserved the database distribution so that my workers did not need to retrieve the same archive repeatedly from the public service. It did not preserve the installed state Grype had prepared inside the MegaLinter container. The proxy reduced acquisition cost; I needed a second cache for prepared state.
The distinction is easier to see in retrospect. It was harder to see while looking at a timing report containing the word grype and a number close to 190 seconds.
Preserving the right state
I considered placing Grype’s database cache on shared network storage because my Jenkins environment has NFS available, and a shared cache would allow multiple workers to use a common database. I decided against it. Grype’s active vulnerability database is SQLite, and database updates replace the active database directory atomically. Sharing a writable cache across multiple Jenkins workers would introduce concurrency and locking questions that I did not need to answer. It would also make the linting infrastructure more dependent upon my storage topology.
A node-local Docker volume was a better match for the problem. Each Jenkins worker could maintain its own persistent Grype database:
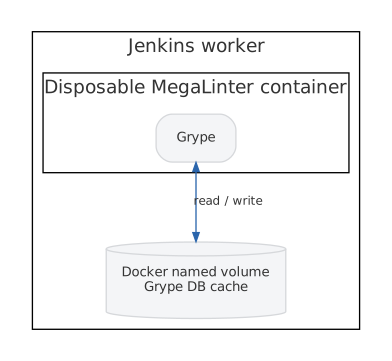
The worker might occasionally pay the cold-start cost when its cache was empty or stale. Subsequent MegaLinter containers on that worker could reuse the installed database without sharing a writable SQLite file with other nodes.
I kept this optimization optional for the same reason I had kept Nexus and my registry proxy out of the repository’s required configuration. The Makefile gained two variables:
LINT_GRYPE_CACHE_VOLUME ?=
LINT_GRYPE_CACHE_DIR ?= /var/cache/grype/db
It then constructs the additional Docker arguments only when a cache volume has been supplied:
LINT_GRYPE_CACHE_ARGS :=

ifneq ($(strip $(LINT_GRYPE_CACHE_VOLUME)),)
LINT_GRYPE_CACHE_ARGS := \
	-v "$(LINT_GRYPE_CACHE_VOLUME):$(LINT_GRYPE_CACHE_DIR):rw" \
	-e GRYPE_DB_CACHE_DIR="$(LINT_GRYPE_CACHE_DIR)"
endif
The lint target becomes approximately:
lint:
	docker run --rm $(LINT_GRYPE_CACHE_ARGS) \
		-v "$$(pwd):/tmp/lint:rw" \
		-e GRYPE_DB_UPDATE_URL="$(LINT_GRYPE_DB_URL)" \
		$(LINTER)
With the default:
LINT_GRYPE_CACHE_VOLUME=nothing is mounted. The repository continues to work with Docker and Internet access alone.
In Jenkins, I supply an organization-level value similar to:
LINT_GRYPE_CACHE_VOLUME=grype-db-cacheDocker then mounts:
grype-db-cache:/var/cache/grype/dband Grype receives:
GRYPE_DB_CACHE_DIR=/var/cache/grype/dbAt that point, the architecture contained two different caches serving two different purposes:
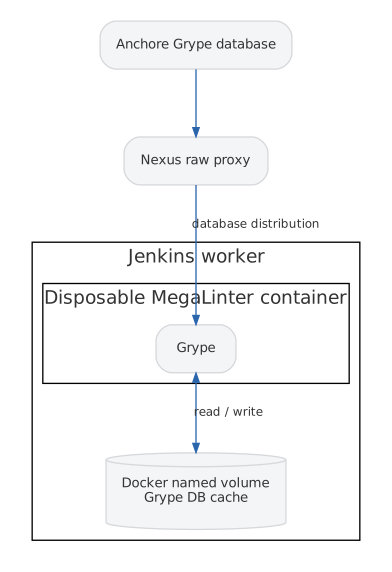
Nexus caches what Grype downloads, while the Docker volume caches what Grype prepares. That was the distinction I had been missing.
The experiment that answered the question
The first Jenkins run with the new Docker volume still took approximately 192 seconds, which was expected because the volume was empty. Grype still had to populate it, so the first execution behaved like every previous cold execution.
The next run was the useful one. It used the same repository, Jenkins worker, MegaLinter configuration, and Grype behavior, including --add-cpes-if-none. The difference was that the second disposable MegaLinter container could see the database state left behind by the first one.
The result was:
| Cache state | Grype runtime |
|---|---|
| No persistent Grype cache | ~187-193 seconds |
| Persistent cache, first run | ~192 seconds |
| Persistent cache, second run | 4.2 seconds |
Using 190 seconds as a representative uncached result, the change was approximately 190.0 seconds to 4.2 seconds. That is more than a 45x speedup, or approximately a 98 percent reduction in Grype runtime.
The repository and vulnerability database were unchanged, --add-cpes-if-none remained enabled, and Grype itself had not been replaced. The difference was that I stopped asking Grype to reconstruct its working database state inside a filesystem that I deleted after every invocation.
Once the cache was warm, the MegaLinter timing profile looked like this:
| Linter | Runtime |
|---|---|
| editorconfig-checker | 0.04s |
| npm-groovy-lint | 39.85s |
| betterleaks | 3.33s |
| checkov | 55.46s |
| git_diff | 0.03s |
| grype | 4.20s |
| kingfisher | 18.70s |
| secretlint | 2.44s |
| syft | 14.27s |
| trivy | 30.50s |
| trivy-sbom | 0.27s |
| trufflehog | 6.00s |
| cspell | 9.97s |
| prettier | 0.88s |
| v8r | 13.09s |
| yamllint | 1.67s |
Grype had gone from the overwhelming outlier to one of the faster scanners in the run. Checkov, Trivy, and Groovy linting now presented a more balanced timing profile to investigate.
Why both caches stayed
Once the Docker volume produced the large runtime reduction, I considered whether the Nexus proxy still justified its existence. I kept it because the two layers address different parts of the lifecycle.
A Jenkins worker that has never run Grype has an empty Docker volume. A worker may also need a new database when Grype publishes an update. Without Nexus, each worker retrieves the necessary archive independently from the public service. With Nexus, the first request populates the local proxy, and subsequent workers retrieve the distribution from within my network.
The resulting hierarchy is:
| Cache layer | Purpose |
|---|---|
| Nexus raw proxy | Caches the compressed Grype database distribution |
| Jenkins worker Docker volume | Caches Grype’s installed database |
This arrangement also preserves a property I wanted from the beginning: Jenkins nodes do not share a writable SQLite database. Each worker owns its local prepared state, while Nexus shares only the database distribution being retrieved.
I deliberately avoided several other possible responses to the problem. I did not disable Grype merely because the timing looked bad, since the investigation eventually showed that the scanner itself was not responsible for most of the elapsed time. I did not introduce a shared writable NFS cache whose concurrency behavior I would then need to manage. I did not hardcode private hostnames into public repositories, and I did not turn the cache into a requirement for make lint.
The local infrastructure improves the execution path while the repository remains capable of operating without it. That is the same architectural principle I had already adopted for the larger Jenkins migration.
What the three minutes were actually measuring
This investigation started because Grype appeared to need approximately three minutes to scan a 12.3 KB Bash artifact, and that framing sent me toward the scanner first. The more useful question turned out to be what Grype was spending those three minutes doing around the scan.
Containers make it natural to regard their filesystems as disposable state. That is often one of their advantages. Some applications, however, depend upon external datasets whose acquisition and preparation costs can dwarf the workload being analyzed. If that prepared state lives only inside a container started with docker run --rm, every execution can become a cold start. The timing report still attributes that time to the tool, while the architecture explains what the number actually means.
I also learned something from the Nexus experiment that I want to keep. The proxy was a valid optimization that solved a genuine problem and behaved exactly as designed. It barely changed the number I cared about because I had misunderstood which stage of the operation dominated the result.
Before deciding that a tool is slow, it can be useful to separate acquisition, initialization, preparation, analysis, and cleanup. A long elapsed time does not tell us which of those phases deserves attention.
I eventually posted a condensed version of the investigation to the MegaLinter discussion board as “Griping about Grype (Grype was taking a very long time on a very small repo)”, partly to document the result and partly because I doubt I am the only person running MegaLinter in disposable containers who might be surprised by this behavior.
In this case, the scan was fast. I had to stop throwing its database away.